Writing · MCP infrastructure
Audit logging for n8n workflows that call MCP tools
Your n8n execution log shows the MCP node ran. It doesn't show what the agent asked the tool to do. A 5-minute swap that fixes that.
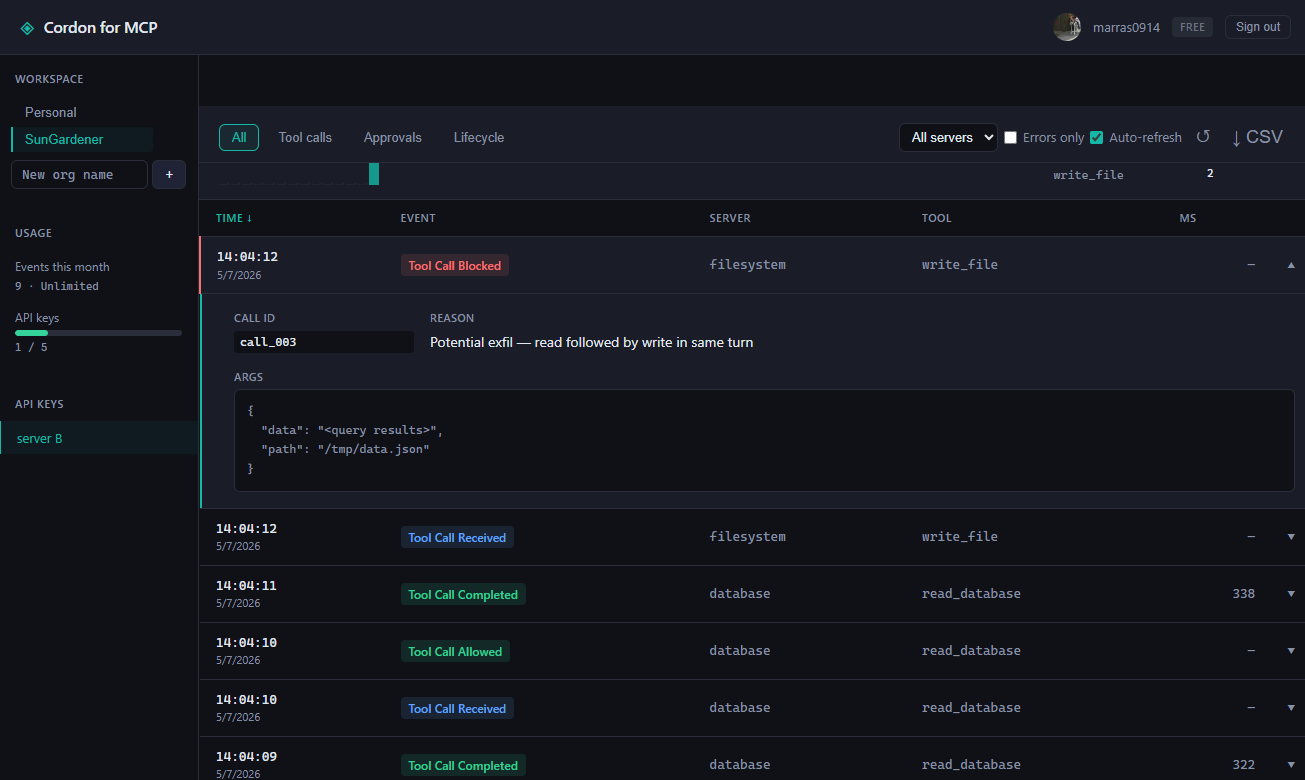
If you run an n8n workflow that calls MCP tools, here's something you've probably hit. The execution log shows the MCP Client Tool node ran. It doesn't show what the agent asked the tool to do, or what it got back.
That's a gap. If the agent loops, or hits a tool you didn't expect, or sends arguments you wouldn't have approved, the execution log just says "MCP Client Tool: success."
I built Cordon for this gap. It's free and open source, getcordon.com.
What Cordon is
Cordon is an MCP gateway that sits between your MCP client and any upstream MCP server, logs every tool call, and lets you write policies that block or pause calls before they fire. Open source, MIT, free.
n8n's MCP Client Tool node takes a URL and a bearer token. That's also exactly what Cordon's HTTP transport exposes. So the swap is a one-field change. Point the node at Cordon, point Cordon at the upstream server, and you get an audit trail of every call your agent makes through n8n.
Setup
Five minutes if you already have n8n running and at least one MCP server you want to put behind it.
1. Install Cordon
npm install -g @getcordon/cli2. Write a config
Cordon reads a cordon.config.ts in the directory you run it from. Point it at whatever MCP server your n8n workflow currently uses.
import { defineConfig } from '@getcordon/policy';

export default defineConfig({
  servers: [
    {
      name: 'filesystem',
      transport: 'stdio',
      command: 'npx',
      args: ['-y', '@modelcontextprotocol/server-filesystem', '/path/to/dir'],
      policy: 'allow',
    },
  ],
  gateway: {
    transport: 'http',
    port: 7777,
    authToken: process.env.CORDON_GATEWAY_TOKEN,
  },
  audit: { enabled: true, output: 'stdout' },
});
3. Start the gateway
export CORDON_GATEWAY_TOKEN=$(openssl rand -hex 16)
cordon start --http
Cordon spawns the upstream MCP server as a child process and listens on http://127.0.0.1:7777/mcp. The stderr line you're waiting for looks like this.
[cordon] HTTP gateway listening on http://127.0.0.1:7777/mcp4. Point n8n at Cordon
In your n8n workflow, open the MCP Client Tool node. Set Server Transport to HTTP Streamable. The SSE option is deprecated, and Cordon serves Streamable HTTP at /mcp. Set the endpoint URL to:
http://127.0.0.1:7777/mcpSet Authentication to Bearer and paste in your CORDON_GATEWAY_TOKEN. Save.
If you're running n8n in Docker and Cordon outside it, swap 127.0.0.1 for your host's IP, or run Cordon in the same Docker network and use the container name. If you're hosting Cordon behind a reverse proxy, the URL becomes https://<your-domain>/mcp and everything else is the same.
What you see
Run your workflow. Cordon prints a line of audit JSON to stderr for every tool call, with the tool name, the arguments, the response timing.
{"event":"tool_call_received","timestamp":1748000000000,"callId":"call_001","toolName":"read_file","args":{"path":"/data/notes.md"}}
{"event":"tool_call_completed","timestamp":1748000000350,"callId":"call_001","toolName":"read_file","durationMs":350}
That's the visibility n8n's execution log doesn't give you. Now you can see what the agent actually asked the tool to do.
If you want a friendlier surface, run cordon login to authenticate against the hosted dashboard and switch your config's audit output to 'hosted'. Same events, browser table, sortable, exportable.
Gating dangerous calls
You can also tag specific tools with policies. Change a tool's action to 'approve' and Cordon pauses for a human before the call fires. Slack or terminal prompt. Useful when an agent has access to a tool you don't fully trust the agent to use unsupervised.
tools: {
  delete_file: { action: 'block', reason: 'Delete is for manual ops only.' },
  write_file:  { action: 'approve', reason: 'Writes need human review.' },
}
Try it
The whole thing is one install and a node-url swap.
npm install -g @getcordon/cliPoint the MCP Client Tool node at your local Cordon and every call your agent makes lands in the audit log. Run cordon login and that same log opens in a browser instead of stderr, free, no card. That's the fastest way to see what your n8n agents are actually doing.
Start at getcordon.com.
For a fuller example with a real production MCP server in front, here's how I run Cordon over Agent Toolbelt. Same swap, more concrete.